
The Trade Sheet
Every trade in one spreadsheet-style grid — typed, imported, or synced — with a live stats bar up top and fee-inclusive Net R that fills itself in as you go.
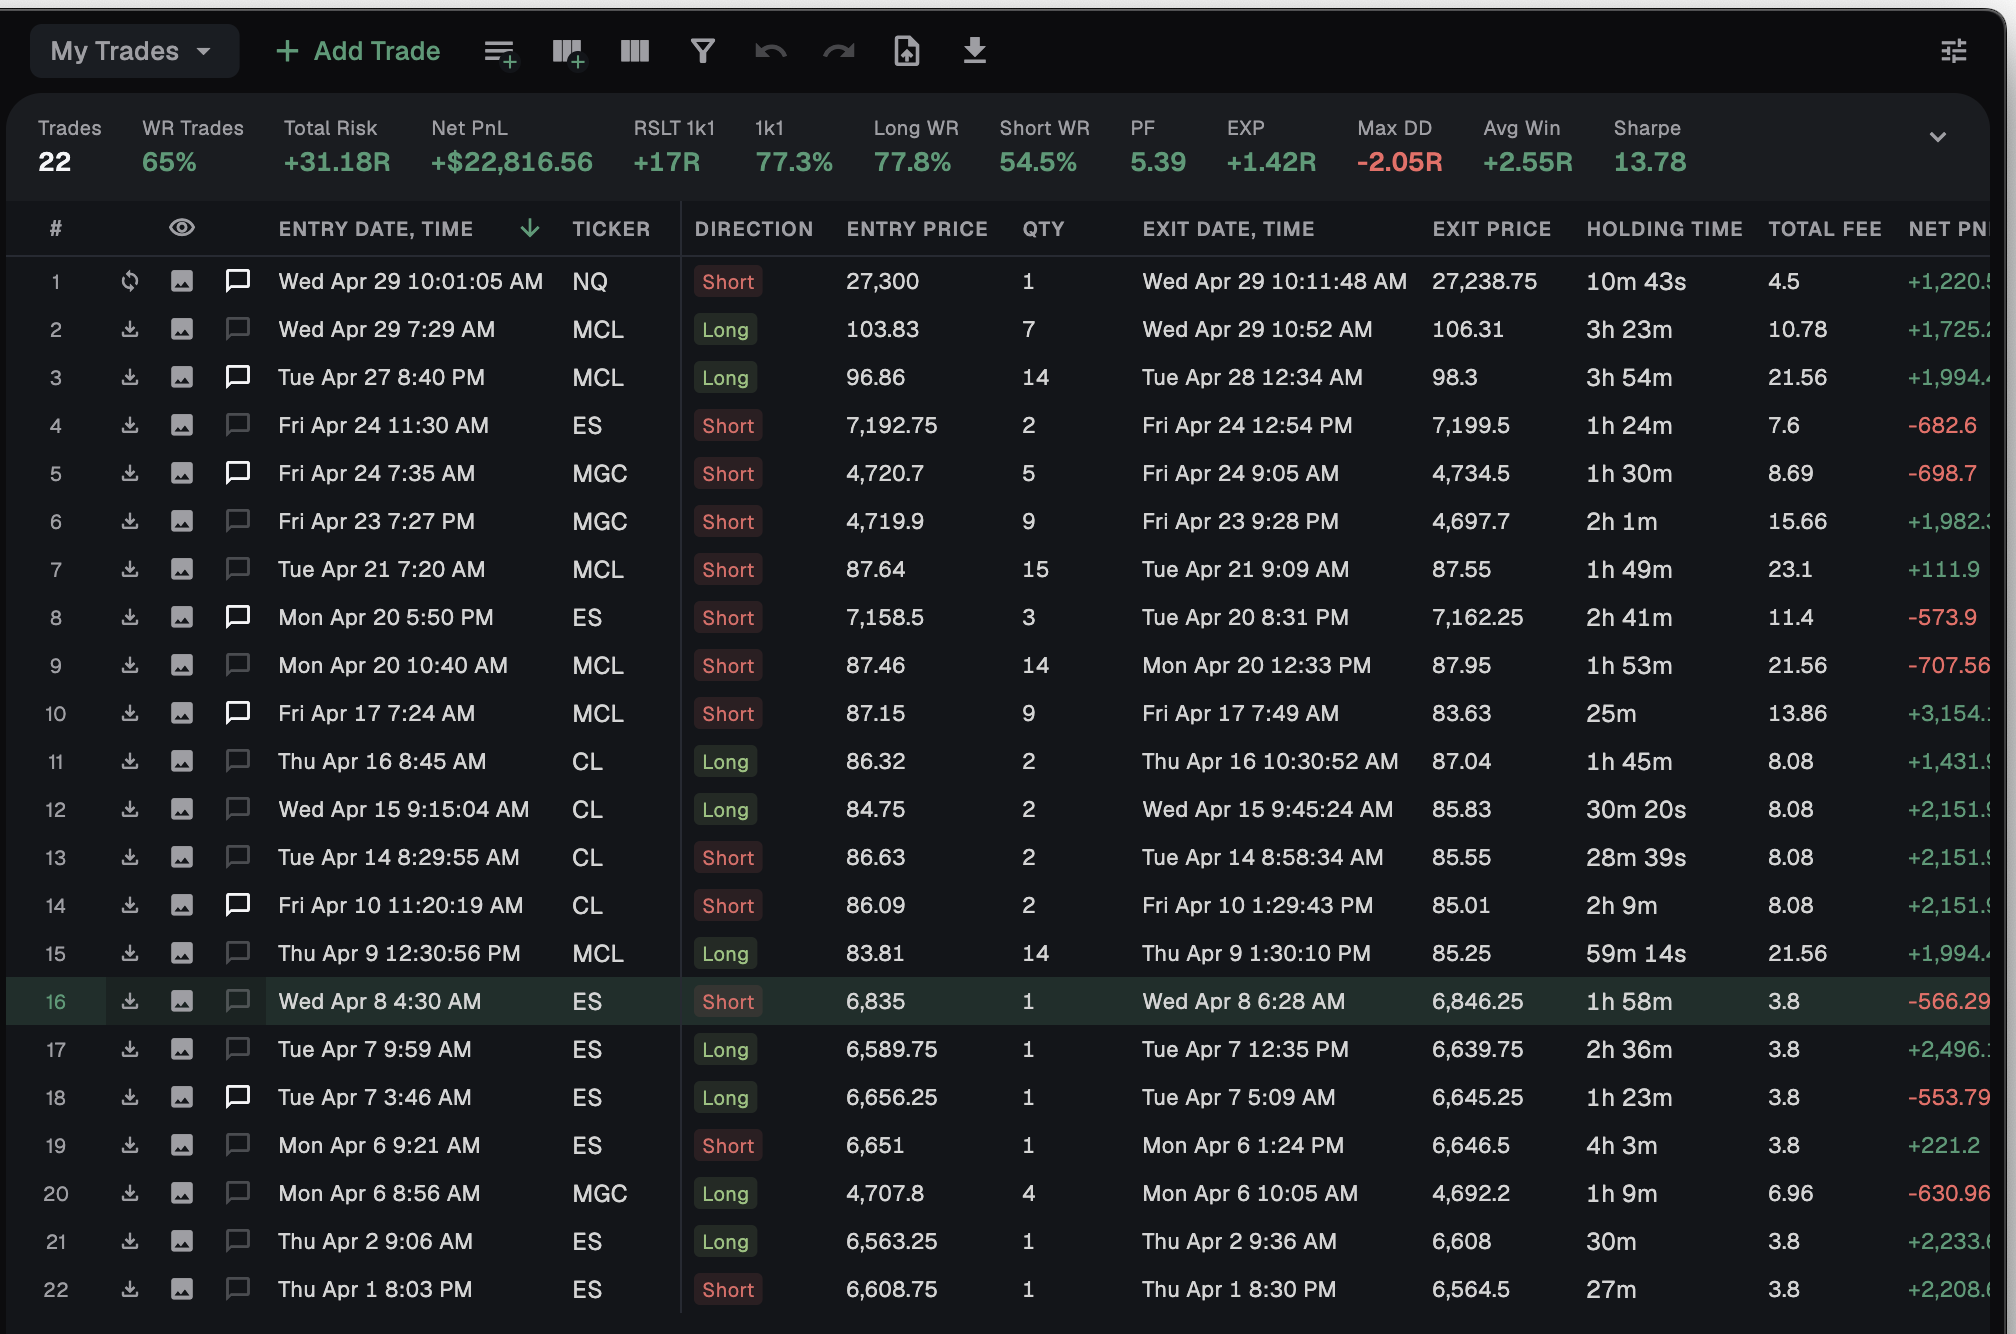
You already keep a trading spreadsheet. It is a mess of half-filled columns, broken formulas, and gross numbers that lie to you about fees. The Trade Sheet is a real spreadsheet built for trading: ~80 semantic field types, unlimited custom columns, and a math engine that computes Net R and Net PnL for you — fees included by default.
A customisable spreadsheet, not a fixed form
Most journals lock you into their columns. The Trade Sheet does the opposite. Trade values live in a dynamic schema driven by a field registry of around 80 semantic field types — across core, prices, tags, psychology, plan, context, analysis, risk, execution, account, review, computed and meta.
Use the defaults — Entry/Exit Date & Time, Ticker, Direction, Asset Class, Gross R, Net R, Session, Setup, Triggers, Stop Loss, Take Profit, Risk $, Quantity, Fee, Gross PnL, Net PnL, Entry Quality, Confidence, Followed Plan, Mistakes, Pre-Trade Plan, Post-Trade Review, Note, Screenshot — or add unlimited custom columns of your own.
Ten cell editor types match the data: text, number, date, time, datetime, dropdown and multiselect as coloured chips, boolean as ✓/✗, autocomplete with history suggestions, and longtext in a modal. There is also a special conditions editor whose options come from your active Setup — Must-Have, Good, Avoid.
- ~80 semantic field types across 13 categories
- Unlimited custom columns
- 10 cell editor types, matched to the data
- Click focuses a cell; click again or F2/Enter edits; Tab and arrows navigate; Esc cancels
| Category | Example fields |
|---|---|
| Core | Ticker, Direction, Asset Class |
| Prices | Entry, Exit, Stop Loss, Take Profit |
| Risk | Risk $, Quantity, Gross R, Net R |
| Execution | Fee, Commissions, Swap, Holding Time |
| Psychology | Emotion Before/After, Confidence, Entry Quality |
| Plan | Setup, Triggers, Followed Plan |
| Review | Mistakes, Pre-Trade Plan, Post-Trade Review, Note |
The numbers that matter fill themselves in
Type your entry, exit, quantity and direction. The Trade Sheet works out the rest — and every number it fills in is fee-inclusive, so it reflects what your account actually kept.
Manual entry always wins. If you type a value, it is never overwritten. An empty computed cell shows in italic grey with a "missing inputs" hint, so you know exactly what to add.
Net R is the headline — your result in multiples of the risk you took, with costs already accounted for. It works from whatever you've logged, finding the most accurate read your inputs allow. No spreadsheet formulas to maintain.
- Gross PnL — your raw profit or loss before costs
- Net PnL — what actually hit your account, with every commission, fee, swap and funding cost removed
- Total Fee — every cost on the trade, rolled into one number
- Net R — your result in R, fees included, from whatever inputs you have
- Utilization % — how much of your planned risk the trade actually used
A stats bar that updates as you type
Pinned at the top of the sheet is a live stats banner — roughly 11 to 16 metrics including Win %, win and loss counts, PnL gross and net, Avg R, Max R, and holding-time stats. Edit a cell and it recalculates immediately.
Click the strip to copy every metric as TSV — straight into a message or another sheet. Hit "Pin & reorder" to drag the banner into the order you want. A chevron expands it into the full by-category metric grid.
Wins and losses are counted by the result you marked on the trade, not by the raw P&L sign. If a metric is missing the column it needs, it shows a "+" so you can add it on the spot.
- ~11–16 live metrics, recalculated as you edit
- Click to copy all metrics as TSV
- "Pin & reorder" for drag-edit; chevron expands the full metric grid
- Wins and losses counted by the result you marked, not the P&L sign
Type it, import it, or sync it
Three ways in, one grid. Type trades by hand with "Add Trade" or drop an empty row with "Quick Add". Import from CSV — Import Trades CSV, Import Orders CSV, or your own saved templates. On a broker-linked sheet, "Sync Now" pulls fills automatically, with a 30-minute cooldown.
Every trade is tagged by source — manual, csv_import, api_sync or user_organized — so you always know where a row came from.
- Add Trade, Quick Add (empty row)
- Import CSV → Import Trades CSV, Import Orders CSV, My Templates
- Export CSV — one click, spreadsheet-ready
- Broker sync with "Sync Now" and a 30-min cooldown
- Every row tagged by source: manual, import, or broker sync
Scaled in or out? It reads as one clean trade
Scaling into a position, then trimming it, can leave a dozen separate fills behind. The Trade Sheet folds them back into one accurate trade. From the row menu, Merge into this trade combines several fills into a single position, Split trade breaks one back apart, and Fills shows the underlying executions any time.
Merging is safe by design. A sticky bottom bar shows a live "Combined N trades · qty X · PnL $Y" summary as you build the merge, and combining across a mismatched symbol or direction is blocked, with a tooltip explaining why. Broker-imported trades can always be reset to their original state.
- Merge several fills into one clean, correct trade
- Split a combined trade back into its parts
- A live "Combined N trades" summary while you merge
- Mismatched symbol/direction merges are blocked; broker trades reset to original
It behaves like the spreadsheet you wish you had
Sort by any single column — click a header to cycle ascending, descending, off. Drag columns to reorder them. Resize with drag for a custom width or double-tap to auto-fit, within sensible limits. Freeze up to two columns so your key fields stay put as you scroll.
Show or hide columns to focus the view — broker-locked columns stay visible by design. Each column gets a filter popup matched to its type: text contains or exact, number min-max, date range with weekday, dropdown and multiselect checkboxes, boolean. Name and manage saved filter presets to switch views in one click.
Everything is undoable. Ctrl+Z and Ctrl+Shift+Z cover the lot.
- Single-column sort, drag-reorder, resize and auto-fit
- Freeze up to 2 columns
- Per-column type-aware filters; saved filter presets
- Undo and redo on everything
Frequently asked
Are the numbers gross or net?
Net by default. Net PnL is what's left after every cost — commissions, fees, swap and funding — and Net R is fee-inclusive too. Gross R and Gross PnL are still there when you want them.
Can I add my own columns?
Yes. On top of around 80 built-in semantic field types, you can add unlimited custom columns and pick the editor that fits — text, number, date, dropdown, multiselect, boolean, autocomplete or longtext.
What happens to scaled-in positions?
They read as one clean trade. Use Merge into this trade from the row menu; a sticky bottom bar shows a live combined summary, and merging across mismatched symbol or direction is blocked.
How do I get my existing trades in?
Type them with Add Trade, import via Import Trades CSV or Import Orders CSV, or connect a broker and use Sync Now. Every row is tagged by source so you know where it came from.
Can I export my journal?
Yes — use Export CSV from the toolbar. It hands you the raw trade data and computed fields, ready for any spreadsheet.
Put your trades in a sheet that does the math
Free to start, local-first, on macOS and Windows. No card required.