
Research
You have a theory about your trading. Research turns it into a question you can answer across every entry — then shows you the aggregate stats on what actually works.
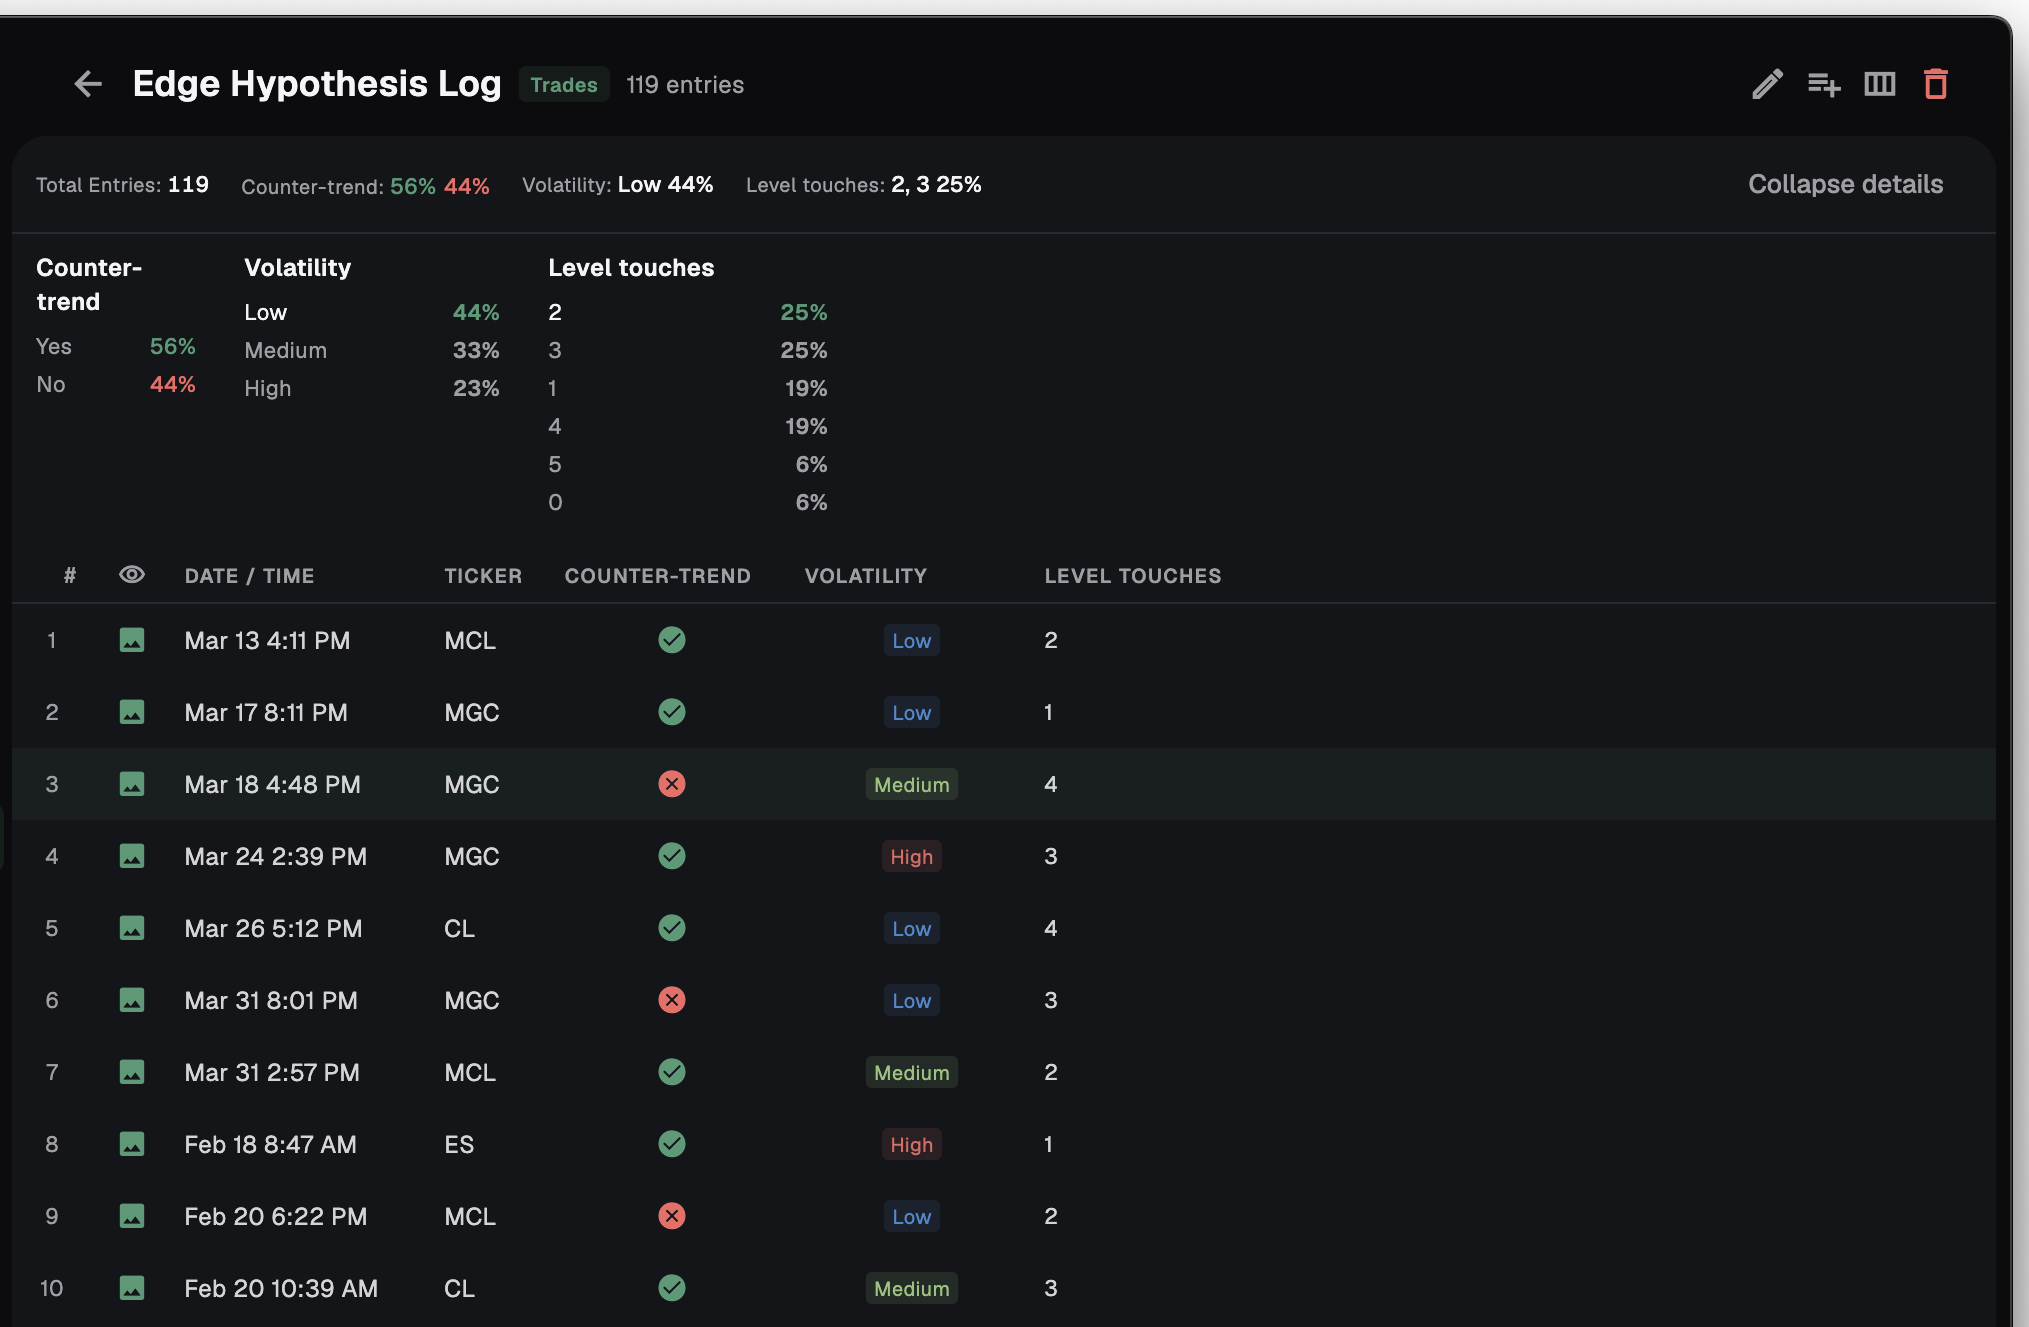
A gut feeling is not evidence. Research is a hypothesis-testing workspace where each project is a Study. Rapidly annotate trades or chart patterns. Define research questions, answer them across many entries, and see aggregate statistics on what works.
Three ways to research
A three-step wizard sets up each Study. The first decision is where the rows come from. Pick the mode that matches the question you are testing.
My Trades auto-pulls from your journal with rich filters — period (Last 7, 30, or 90 days, Last N sessions, Last N trades, or All time), plus ticker, setup, direction, result, session, style, and stop type. Charts lets you add rows by hand to annotate chart patterns: you chart in your own platform and drop screenshots in. Prerequisites lets you define yes/no conditions and measure how often they are met — it auto-creates a Present column.
| Mode | Rows come from | Best for |
|---|---|---|
| My Trades | Auto-pulled from your journal, filtered | Testing a theory against trades you already took |
| Charts | Added by hand, with screenshots | Annotating patterns you spot on the chart |
| Prerequisites | Yes/no conditions you define | Measuring how often your rules were met |
Ask a question, answer it across every trade
A Study is built from questions. Add the type that fits what you are measuring — Yes/No, Dropdown, Multi-select, Number, Text, or Date/Time. Each becomes a column in the research table, with inline editors so you answer row by row.
An always-on Summary Panel sits above the work. It shows Total Entries and the top stats, and expands to a per-column distribution grid: Yes/No bars, top-value lists, and an hourly time-range breakdown. A boolean question reports positive versus negative percent. Text, dropdown, and number questions surface the top value and its frequency. Time questions bucket by hour. The numbers become meaningful from as few as five entries.
- Six question types — Yes/No, Dropdown, Multi-select, Number, Text, Date/Time
- Inline editors — answer directly in the research table, row by row
- Summary Panel — Total Entries plus top stats, always on
- Expandable distribution grid — Yes/No bars, top values, hourly breakdown
- Readable early — useful from roughly five entries
Prerequisites: pass-rates that expose blind spots
Prerequisites mode answers a sharper question: when you took the trade, were your own conditions actually met? Define them as yes/no checks and tick them off with a quick ✓/✗ entry mode.
The detail renders a matrix — prerequisites down one axis, columns across, each cell the percent of times the condition was true. It reports the average yes-percent per condition and surfaces the best and worst. That is where the blind spots show up: the rule you believe you follow, and the rate at which you actually do.
Each Prerequisites card shows ↑ Best and ↓ Worst at a glance — for example 82% best, 45% worst — so the gap between your discipline and your intentions is visible before you open the Study.
Organised and shareable
Studies live as a grid of cards — name, description, top question stats (for example 65% / 35%, or ↑ Best 82% / ↓ Worst 45% for prerequisites), a ticker badge, an entry count, and the modified date. Search and sort across them, and file them into Groups.
Each entry can link to a real trade, so a finding is one click from the position that produced it. The card menu covers the rest: Share to mentor, Move to Group, Export CSV, Edit, Delete.
- Groups — folder your Studies
- Link to a trade — jump from an entry to the real position
- Share to mentor — send a Study for review
- Export CSV — take the data with you
- Search and sort — find a Study fast
Frequently asked
What is a Study?
A research project. You define questions, answer them across many entries, and see aggregate stats on what works.
Do I have to enter trades by hand?
Not in My Trades mode — it auto-pulls from your journal with filters. Charts mode is manual so you can annotate patterns with screenshots, and Prerequisites mode uses yes/no checks.
How many entries before the stats mean anything?
They become meaningful from as few as about five entries.
Can I get the data out?
Yes. Export any Study to CSV from the card menu.
Can I connect a finding back to the actual trade?
Yes. Entries can link to a real trade, so you can jump straight to the position behind a result.
Stop guessing what works
Ask a question, answer it across your trades, and read the stats. Free to start, local-first, on macOS and Windows. No card required.