
Distributions
An average hides everything that matters. Distributions shows you the shape underneath it.
Two traders can post the same average and trade nothing alike. One grinds small and steady, the other survives on a few outliers. Distributions answers the question an average can't: what is the shape of my results? It reads your whole sheet and updates live as trades change.
Three lenses on your edge
Three charts, one read. Each one shows a different property of your record that a single number erases.
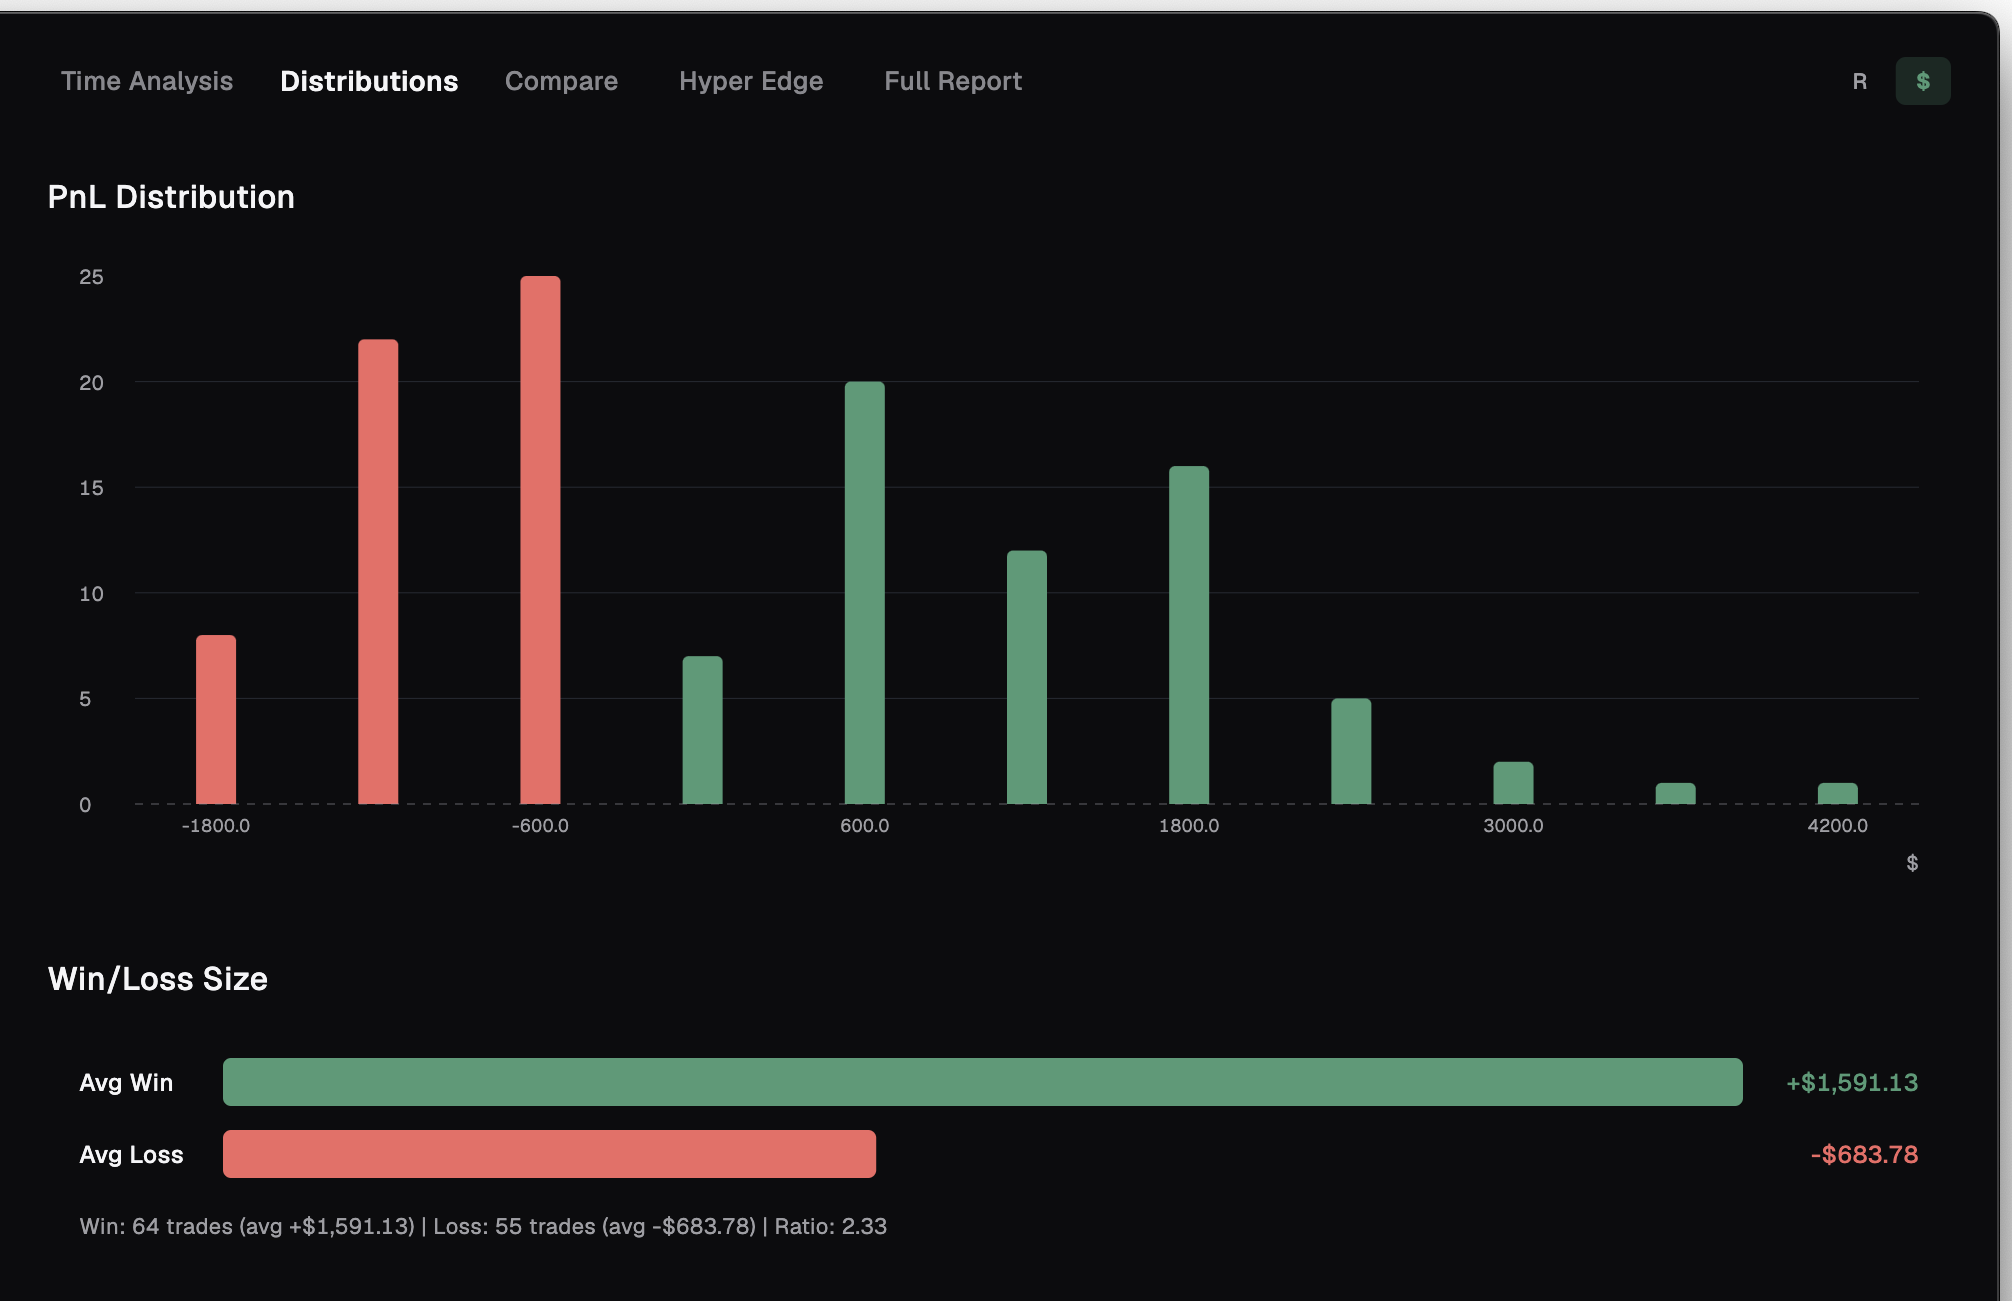
- P&L / Risk Distribution — a histogram of every trade's outcome, so the spread and the tails are visible.
- Win/Loss Size — your Avg Win against your Avg Loss, side by side.
- Streak Distribution — how long your winning and losing runs actually go.
An R / $ toggle switches every chart between risk multiples and dollars. Look in R to judge the system, in dollars to feel the account.
Your outliers and fat tails
The Risk Distribution stacks every trade by its result — green above break-even, red below, with a break-even line drawn through the middle. The taller a bar, the more often you land that outcome.
This is where the shape shows. A fat right tail means a few big winners are carrying you. A fat left tail means an occasional blowup is quietly eating the grind. The break-even line tells you, at a glance, how much of your record sits on the wrong side of zero.
Averages bury all of that. The histogram puts it on the surface.
Winners vs losers, and your streaks
Win/Loss Size sets your Avg Win beside your Avg Loss. The gap between the two bars is the heart of your edge: a small average winner against a large average loser is a warning, no matter how often you win.
Streak Distribution shows how long your winning and losing runs actually stretch. It tells you what a normal cold spell looks like for you — so when the next one hits, you know whether it is variance you have seen before or something new.
Together they separate two different kinds of trader: the one who wins often but small, and the one who wins less but lets it run.
Frequently asked
Does this use my whole record?
Yes. Distributions reads your entire sheet and updates live as trades change.
Can I see this in R instead of dollars?
Yes. An R / $ toggle switches every chart between risk multiples and dollars.
Why look at shape instead of the average?
Because the average hides the tails. Two records with the same mean can be built on completely different distributions, and only one of them is durable.
Are the figures net of fees?
Yes. Every chart is fee-inclusive Net R and Net P&L.
See the shape of your edge
Free to start, local-first, on macOS and Windows. No card required.