
Time Analysis
Most of your edge lives in a handful of hours. The rest is tuition. Time Analysis shows you which is which.
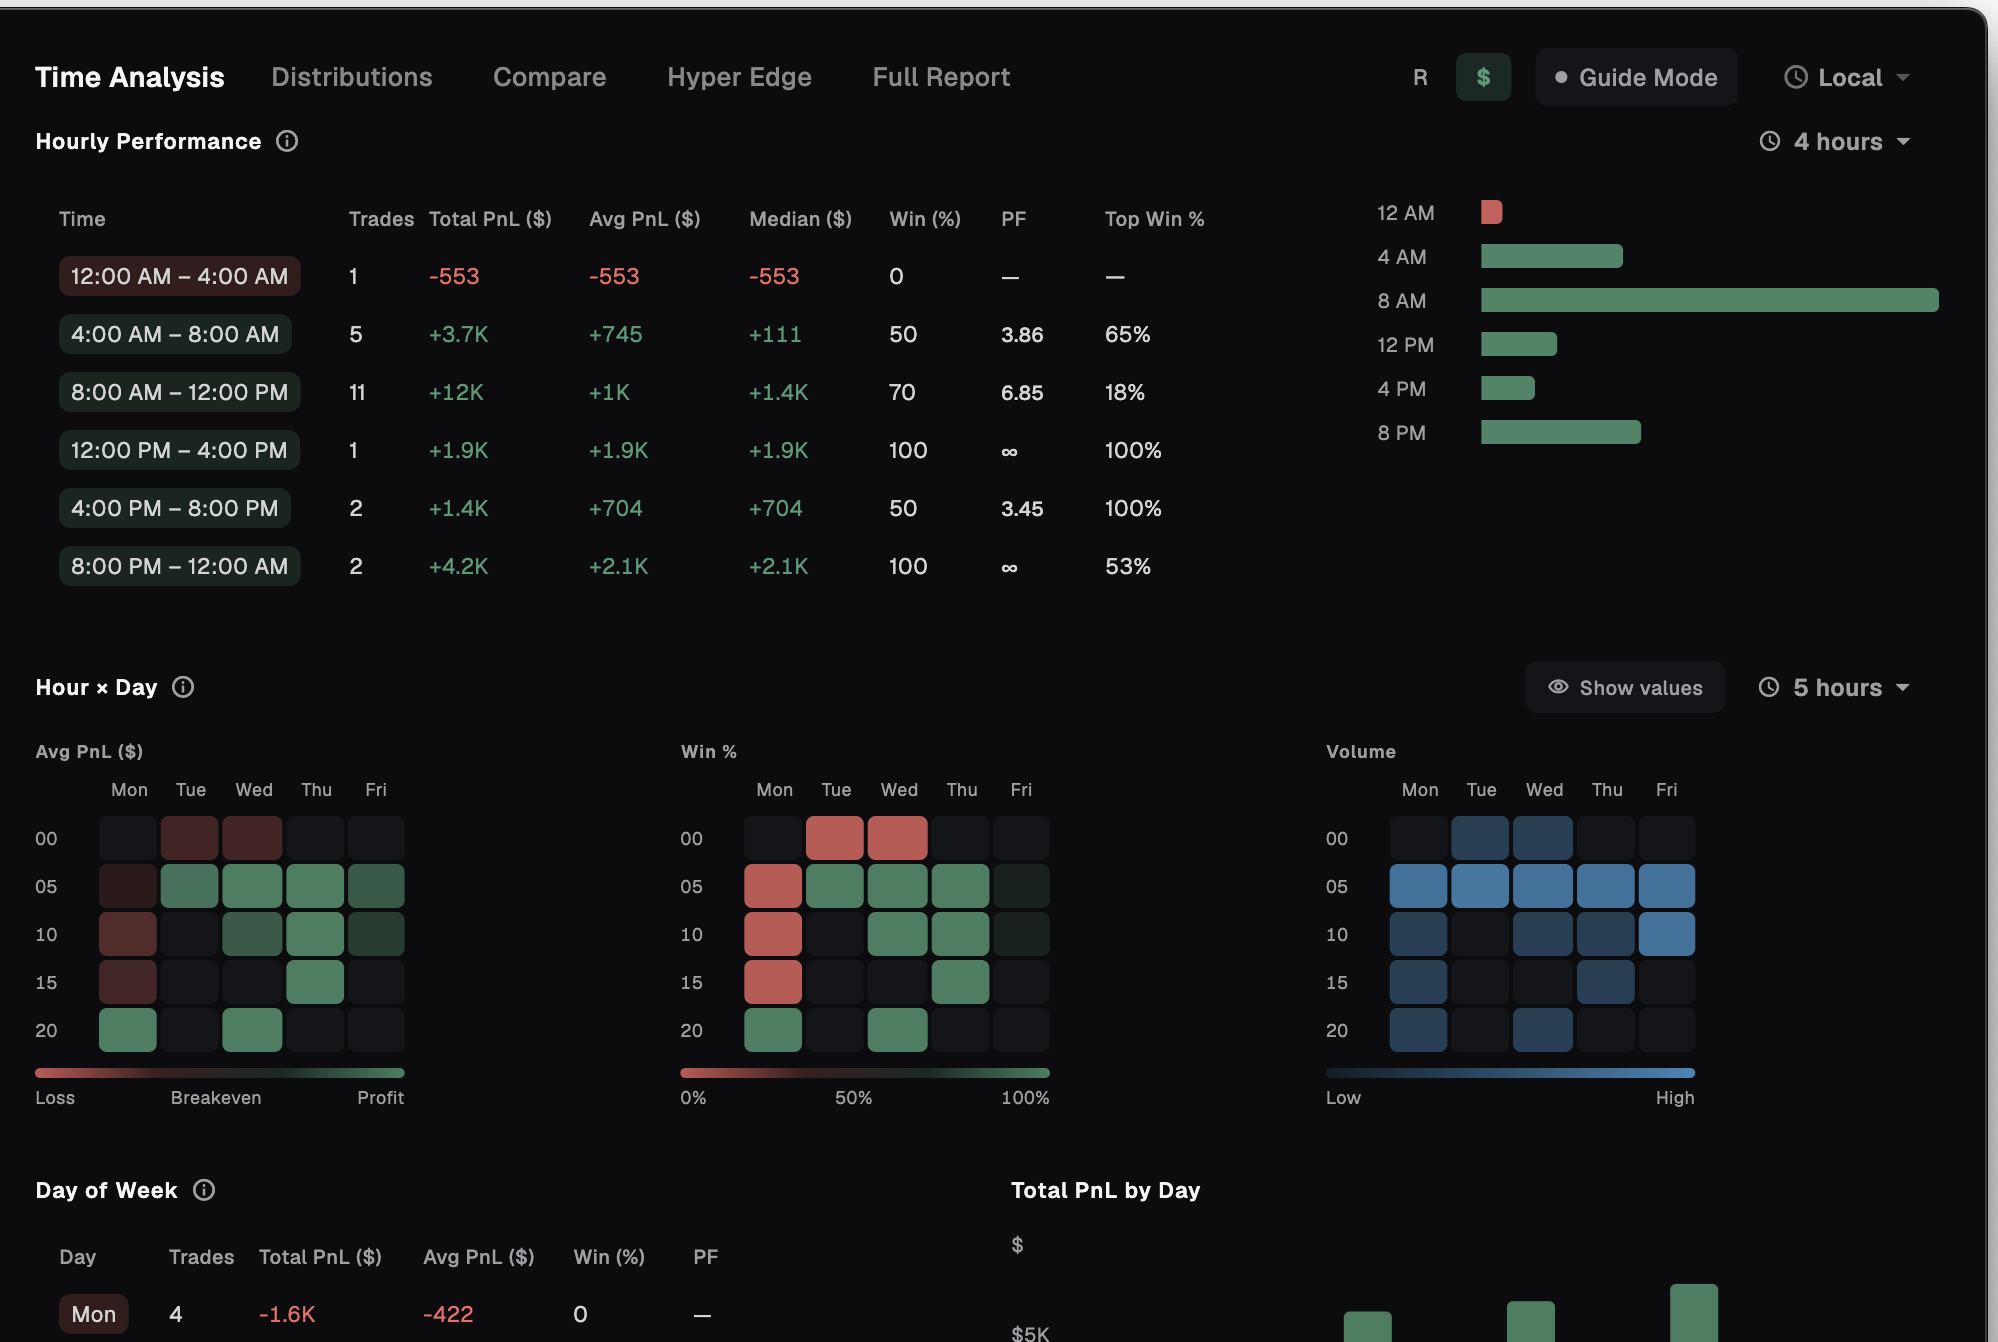
You do not trade the same in every hour, on every day, or on your fifth trade of the morning. Time Analysis breaks your record apart by the clock and asks one question: when do you actually make money, and when are you just paying tuition? Everything here is fee-inclusive Net R and Net P&L.
Seven views of your timing
One question, seven angles. Each view slices your trades a different way so a pattern that hides in the average shows up plainly.
Start at the top and work down. The early views tell you where, the later ones tell you when to stop.
- Hourly Performance — a per-hour table with bars. Your best and worst hours, side by side.
- Hour x Day — a heatmap of hour-of-day against day-of-week. Your real trading window, in one grid.
- Day of Week — which days carry you and which drag.
- Trade Duration — Avg Hold Time — average hold for your winners against your losers.
- Hold Time vs PnL — a scatter plot with a trend line. Does holding longer help you, or hurt you?
- Session Performance — grouped by the session label on your trades.
- Trade Sequence — Tilt Analysis — performance by your Nth trade of the day. Would you do better if you stopped after trade #2?
The Hour x Day heatmap
Three grids, perfectly aligned: Avg P&L, Win %, and Volume. Each one is laid over hour-of-day down the rows and day-of-week across the columns, so a cell in one grid is the same slot in all three.
Read them together. Where all three line up green is your real trading window — profitable, consistent, and you actually trade it. That is where your edge lives.
The same alignment exposes overtrading. When Volume is heavy in hours where Avg P&L is red, you are not working your edge — you are feeding it back. Those cells are the first thing to cut.
Hold time and tilt
Three views answer whether your hands are the problem.
Trade Duration puts your average hold for winners next to losers. If you hold losers far longer than winners, you are letting trades run against you and cutting the ones that work.
Hold Time vs PnL plots every trade by how long you held it, with a trend line through the cloud. A trend that slopes down tells you patience is costing you, not paying you.
Trade Sequence — Tilt Analysis ranks performance by your first trade of the day, second, third, and on. When the numbers fall off after a certain trade, that is your stop sign — the point where revenge and boredom take over.
Guide Mode and controls
Turn on Guide Mode and each block shows an ideal-versus-warning pattern with a blunt rule to follow. No interpretation required.
The rules are written to be acted on, not admired:
- "Trade only your green hours. Stop entering in red ones entirely."
- "If a day is red across multiple weeks — it's not a bad week, it's a bad day for your system. Stop trading it."
- "Win% drops after trade #2 → hard limit: 2 trades per day max."
Switch between risk multiples and dollars, set the timezone to Local, UTC, or a custom offset, and tune the time buckets anywhere from five minutes to four hours. Coarse buckets show the shape; fine buckets find the exact hour.
Frequently asked
How are trading sessions detected?
They are not auto-detected from clock time. Session Performance groups by the session label on your trades, so it reflects how you tag them.
Can I change the timezone?
Yes. Choose Local, UTC, or a custom offset. Every time view re-buckets to match.
R or dollars?
Both. An R / $ toggle switches every view between risk multiples and dollars.
Are the numbers net of fees?
Yes. Everything in Time Analysis is fee-inclusive Net R and Net P&L.
Find your green hours
Free to start, local-first, on macOS and Windows. No card required.