
Full Report
One page. 100+ metrics. No charts to decode — just your numbers, top to bottom.
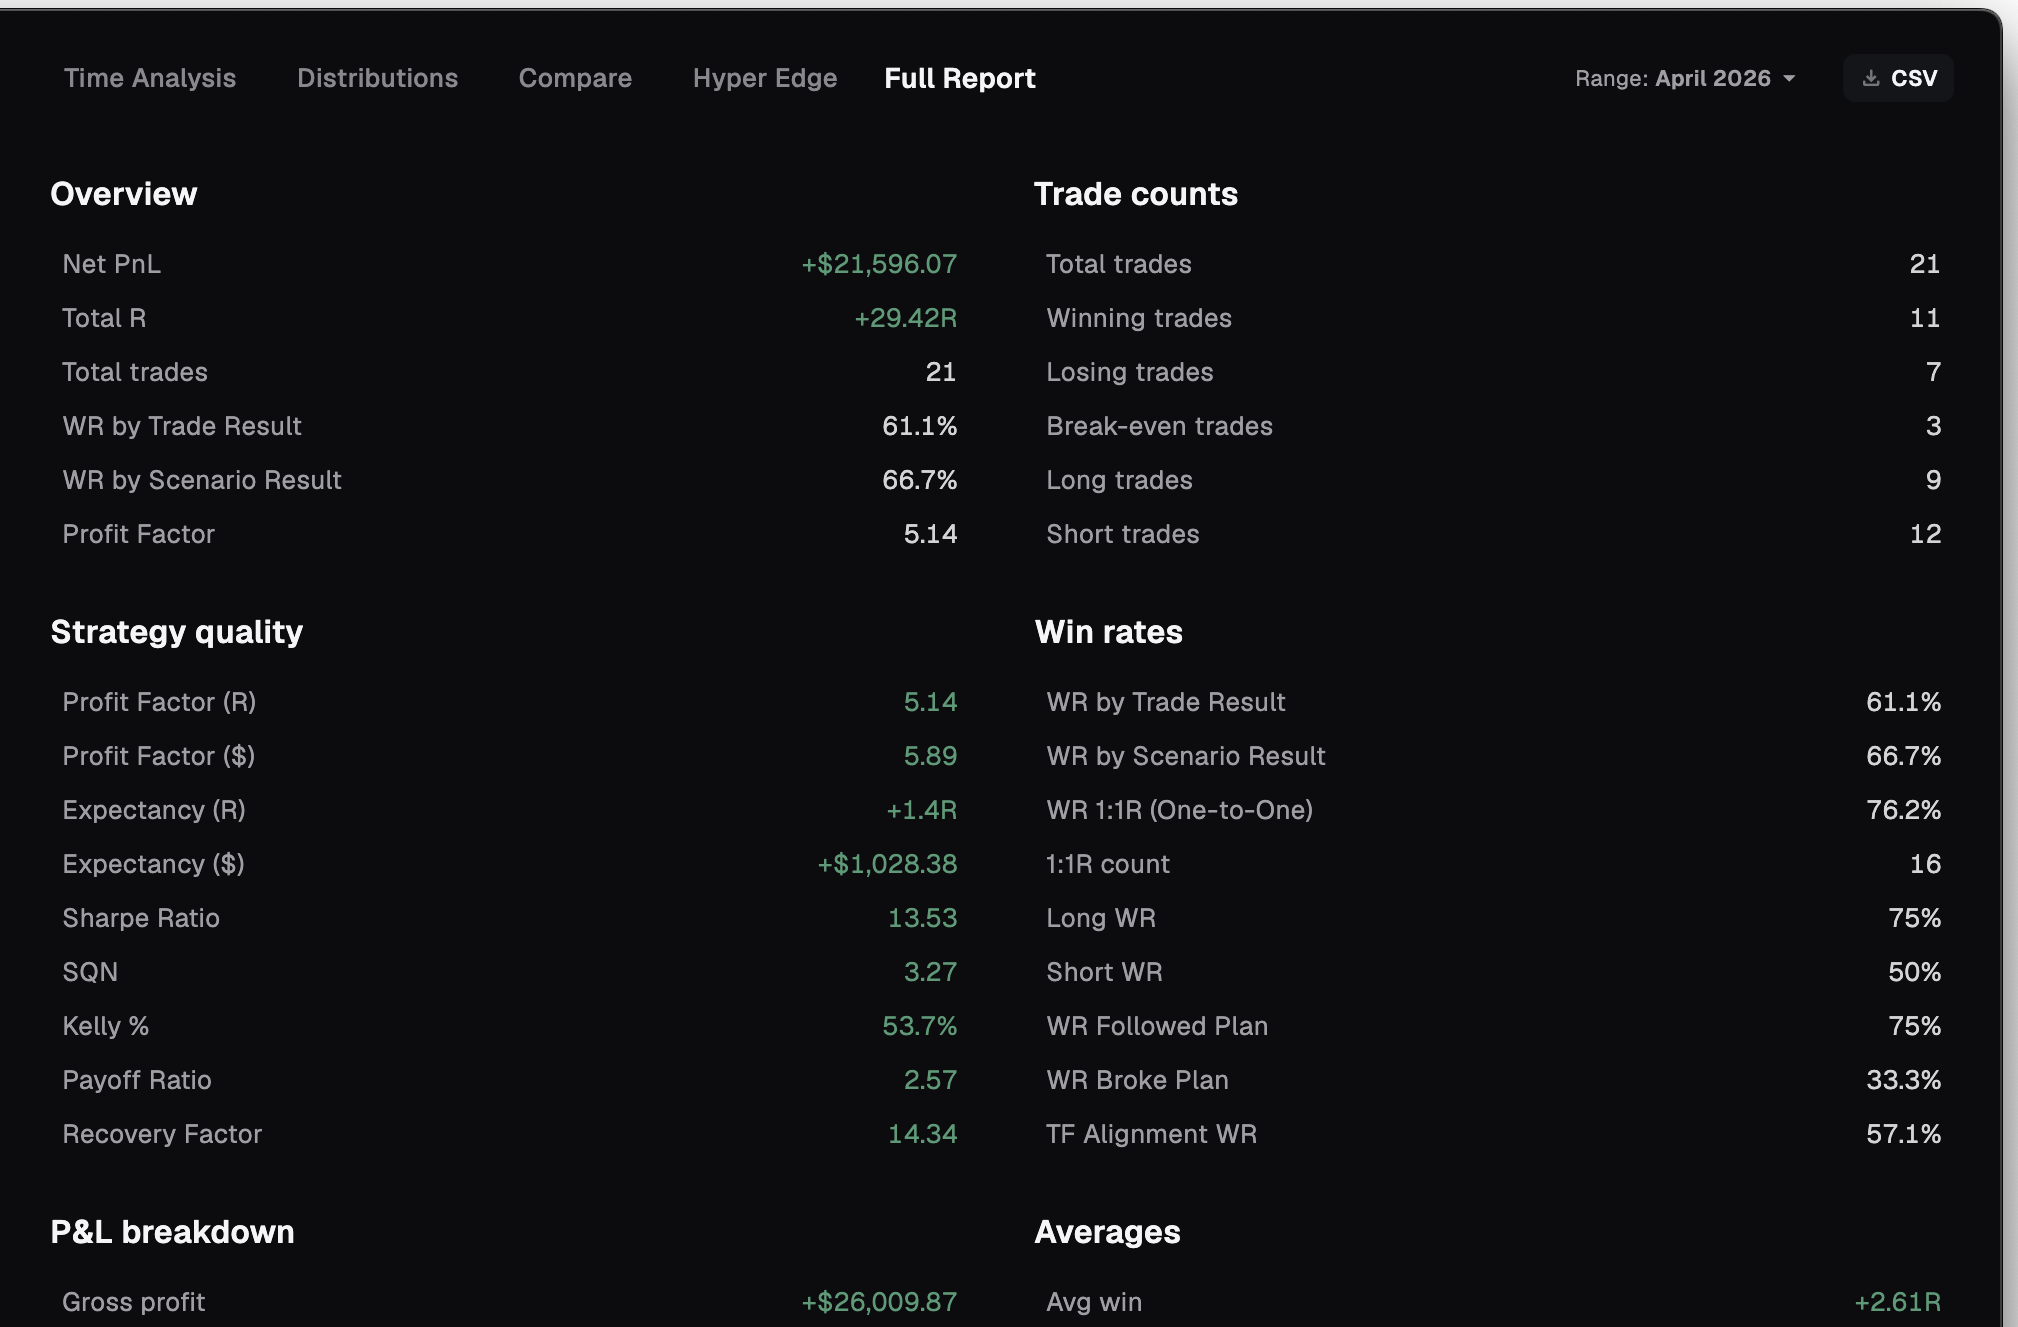
Dashboards make you hunt across charts for the one number you wanted. The Full Report doesn't. It's a single-page, tables-only scorecard — 100+ metrics across 13 sections, deliberately no charts, laid out to be read from top to bottom.
Your complete scorecard
Thirteen sections, stacked. Start at the top with the big picture and read down into the detail. Nothing is hidden behind a tab or a tooltip.
Tables, not charts — on purpose. When you want the actual figure, a chart slows you down. This view hands it to you.
| Group | Sections |
|---|---|
| The big picture | Overview, Trade counts, Strategy quality |
| How you win and lose | Win rates, P&L breakdown, Averages |
| Consistency | Trading days, Streaks, Drawdown & risk |
| Where it comes from | Where's my edge & my hole, Time — best & worst, Symbols — best & worst, Long vs Short |
Where's my edge & my hole
This is the section traders come back for. "Where's my edge & my hole" ranks 17 attributes of your trades and surfaces the best and worst bucket of each — so you can see exactly where you make money and exactly where it leaks.
It also reports how you actually behave: your win rate when you followed your plan versus when you broke it, and what your mistakes cost you. Numbers that are hard to argue with at the next session.
- Setup, emotion, trigger, entry level
- HTF bias, entry quality, market condition, trade type
- Timeframe, stop type, exit reason, confidence
- Plan adherence, right level, right bias, right execution, mistake tag
For every one of the 17 attributes it shows the bucket that worked and the bucket that didn't. No averaging away the detail.
Methodology-aware metrics
The report names the risk-adjusted metrics serious traders look for, and tells you what each one reveals — without dressing up your record:
It classifies days honestly. A day with one win and four losses is not filed under winners. And when a metric needs a column you haven't filled in, you get a needs column chip instead of a fabricated number.
- Sharpe — return set against how bumpy the ride was
- SQN — how strong and how repeatable your system looks
- Kelly % — a reference point for sizing, given your edge
- Recovery factor — how well profits cover your worst drawdown
- Expectancy — what an average trade is worth to you
- Profit factor — what you make against what you give back
- Max drawdown — the deepest hole you climbed out of
Take it with you
Export the whole report to CSV with the CSV button and open it anywhere — a spreadsheet, your own analysis, your records. CSV keeps the data portable and yours.
Empty until you've logged something: "No data for the full report" and "Add trades in the Trades tab to see the report".
Frequently asked
How many metrics does it cover?
More than 100, organised across 13 sections, all on one scrollable page.
Why are there no charts?
It's tables-only by design. When you want the exact figure, a table is faster to read than a chart.
How do I get the report out of Stax?
Use the CSV button — it exports the whole report as CSV, ready for a spreadsheet, your own analysis, or your records.
What does a "needs column" chip mean?
A metric needs data you haven't filled in yet. Rather than show a fake number, the report tells you which column to add.
Read your whole record in one page
Free to start, local-first, on macOS and Windows. No card required.