
Hyper Edge
You have a hunch certain setups work. Hyper Edge tests all of them at once and tells you which ones actually do.
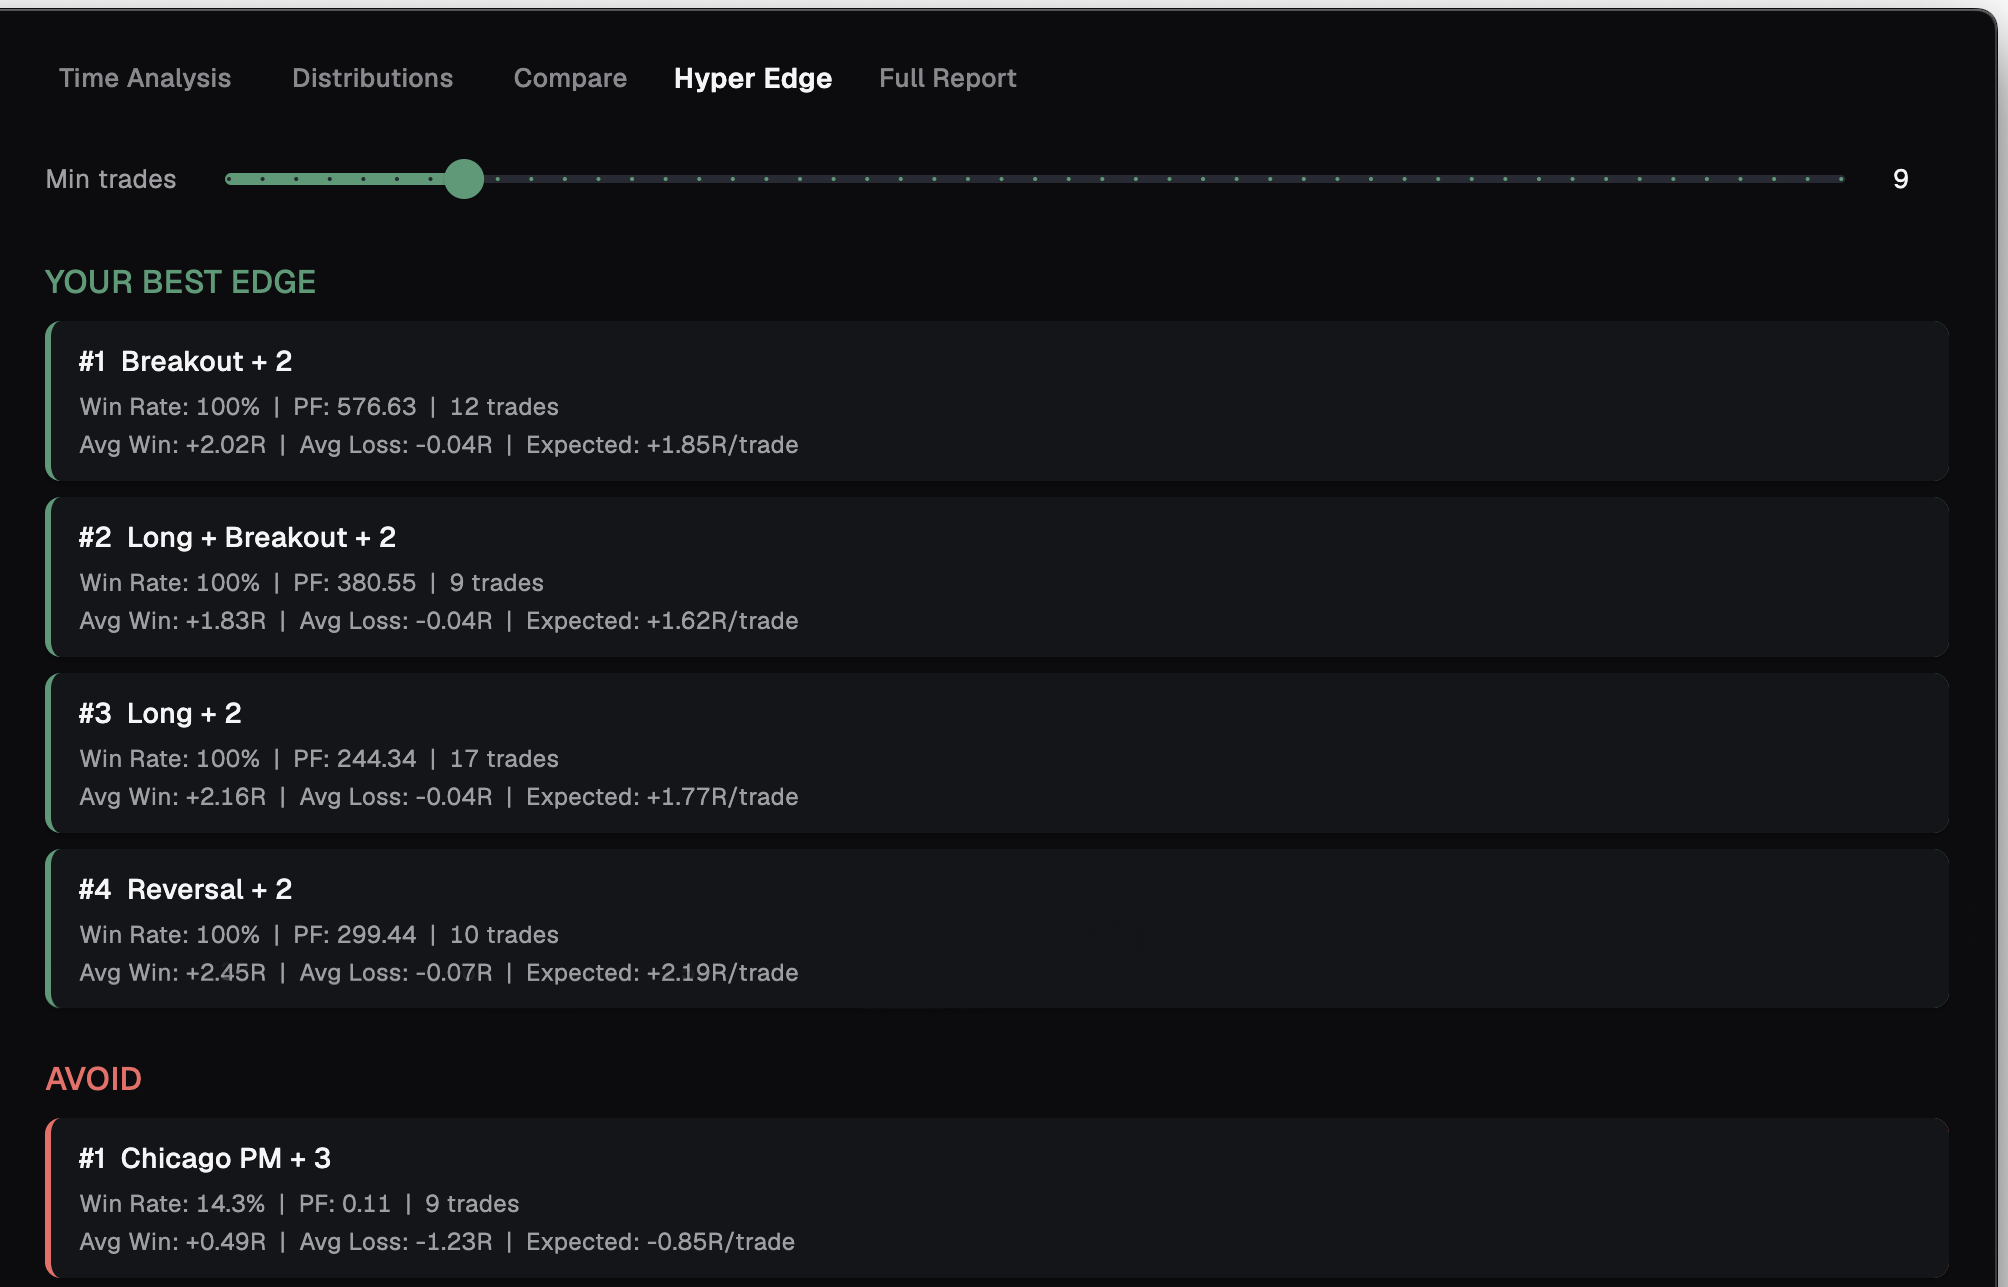
Most journals show you one number at a time and leave you to guess which combinations matter. Hyper Edge does the opposite. It brute-forces every combination of your trading factors, filters your history to each one, and ranks them. Fee-inclusive by default. A paid feature.
It tests what you'd never test by hand
You might check whether your longs work. You might check London. You probably never sit down and check longs in London on a breakout with a tight stop — and the dozens of variations around it.
Hyper Edge does. It takes eight fixed factors and tests every combination from a single factor up to four factors deep. One pass covers far more ground than you could ever filter manually.
These are the eight factors it works with — not every tag in your journal. It combines them up to four deep, so "Long + London + Breakout" is a combination it will find and score on its own.
Ranked so a fluke can't win
A setup that won three trades in a row looks unbeatable on paper. It usually isn't. Hyper Edge ranks combinations in a way that rewards setups that are both profitable and backed by enough trades — so a lucky 3-trade combo can't outrank a 90-trade edge.
You control how much proof you demand. The Min trades slider runs from 2 to 50 and defaults to 10. Raise it to trust only well-tested setups. Lower it to surface emerging ones. As it works you'll see "Analyzing combinations...", then a count like "Evaluated 4,312 combinations (118 met min trades filter)".
- Min trades slider: 2 to 50, default 10
- A higher sample-size requirement means stricter, more reliable results
- Combinations below your threshold are evaluated but not ranked
Your best edges — and what to avoid
The result is two lists. A top-10 YOUR BEST EDGE ranking of the combinations carrying your money, and a bottom-5 AVOID list — the weakest real edges you keep trading, not literally your most-losing individual trades.
Each entry is a card. It shows the combination and its core stats at a glance: "Win Rate: 61% | PF: 2.4 | 84 trades" on one line, "Avg Win: +1.85R | Avg Loss: -0.92R | Expected: +0.34R/trade" on the next.
| Row | What it tells you |
|---|---|
| Combination | The factors that define this setup, e.g. Long + London + Breakout |
| Win rate | How often this setup is marked a win |
| Profit factor | How much it makes against what it gives back |
| Trades | Sample size behind the result |
| Avg win / Avg loss | Typical winner and loser, in R |
| Expected R per trade | What this setup is worth, on average, each time you take it |
Runs on your real trades
Hyper Edge runs locally, in the background, on your full journal — not the period selected on the dashboard. The numbers are fee-inclusive, so an edge that only survives gross costs gets exposed here.
Until there's enough to work with, it stays honest: "Not enough data" and "Add more trades to discover your edge". This is a paid feature.
Frequently asked
Does it use all my tags?
No. It works with eight fixed factors: Ticker, Direction, Session, Style, Stop Type, Entry Quality, Day, and Hour.
How deep do the combinations go?
From a single factor up to four factors deep, like Long + London + Breakout + tight stop.
What is the AVOID list?
Your weakest real edges — combinations you keep trading that don't pay. It is not a list of your single most-losing trades.
Are the numbers net of fees?
Yes. Everything in Hyper Edge is fee-inclusive Net R.
Find the setups that actually pay
Free to start, local-first, on macOS and Windows. No card required.