
Psyche Profile
Eight archetypes, five scales, one Edge score. Built only from your own trades and tags — and honest enough to say not scored when it can't tell.
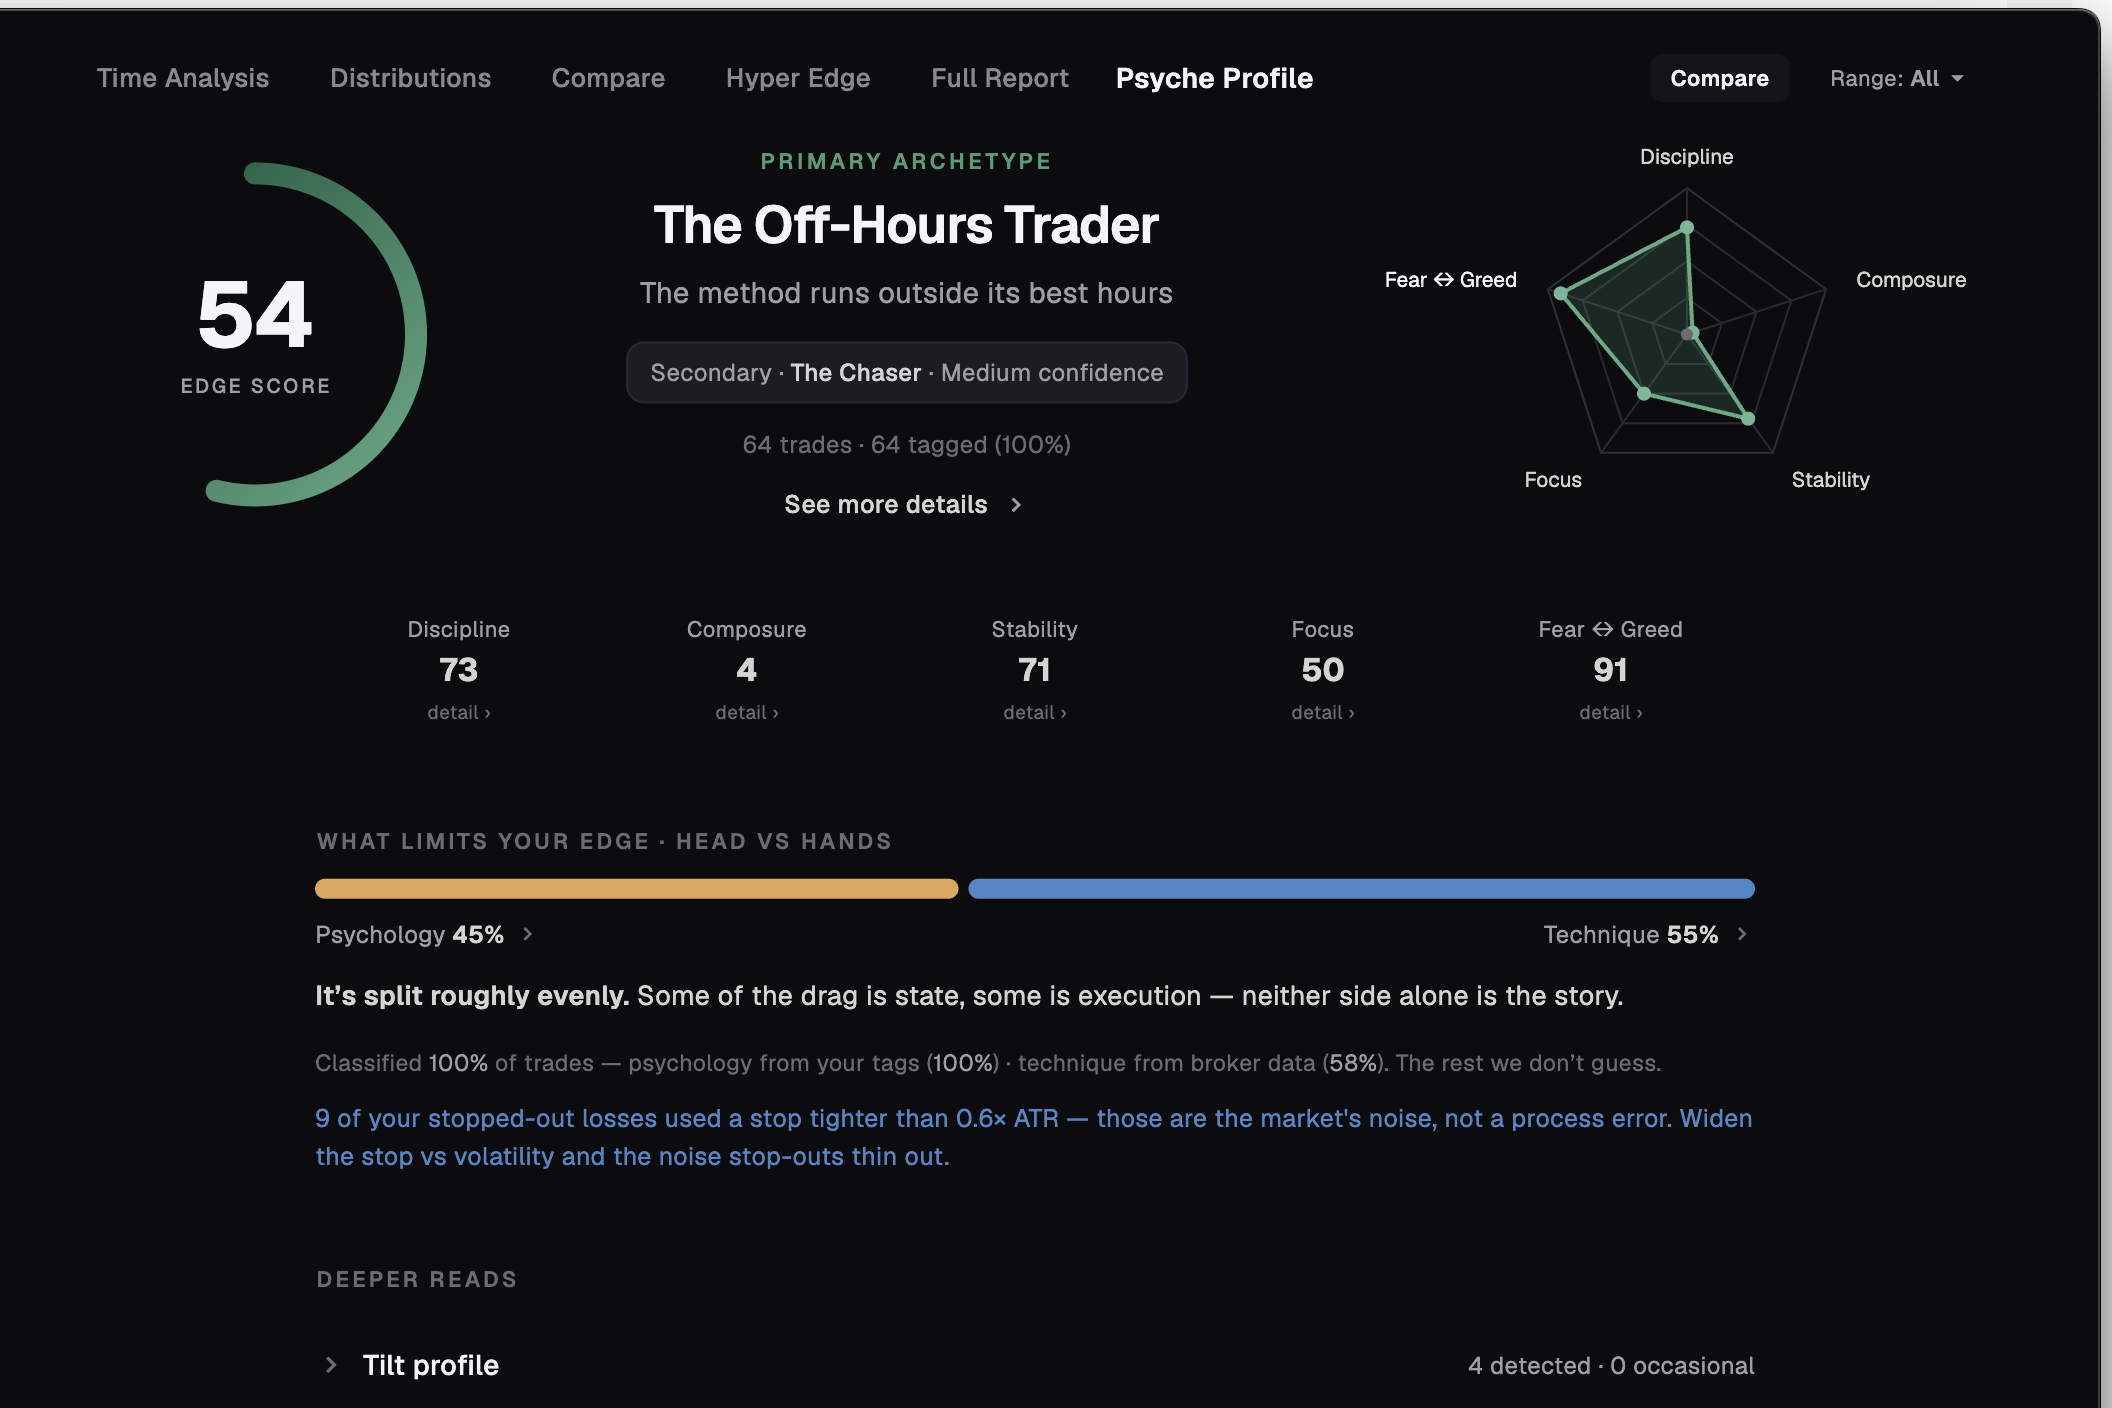
Every other tab in the Analytics Hub tells you what happened. The Psyche Profile tells you who was trading. It reads the journal you already keep — your trades and the tags you log — and turns it into a behavioural read: an Edge score, a primary and secondary archetype, five scales from Discipline to Fear ↔ Greed, your tilt patterns, and a straight answer to the question every trader asks after a bad week: was it my head or my hands? One thing first: every archetype and score here is a name for a pattern in your trade data — a read of your trades, not a psychological assessment of you.
Edge score and your archetype
The top of the tab is the read at a glance. On the left, an Edge score from 0 to 100 on a dial. In the middle, your primary archetype with its one-line tell — and, when a second pattern is strong enough, a chip for the secondary archetype with how confident the read is. On the right, the five-spoke radar.
Edge is not your P&L. It reads what an average trade is worth to you together with how you behave — discipline, composure, stability, focus and your fear-greed balance — so it can climb while the account is flat, and it shifts as the journal grows. A scale with no data is skipped, never counted as zero.
See more details opens the full read: a description of each archetype written from your own numbers — "You re-enter within 5 minutes on 38% of post-loss trades" — the one thing it says to tighten, and trait chips that show the evidence.
- Edge score — 0 to 100; what your average trade is worth, read together with how you behave
- Primary archetype — the strongest pattern in your window, with its tell
- Secondary archetype — the runner-up, with Low, Medium or High confidence as the sample grows
- Trades · tagged — how many trades the read stands on, and how many of them carry tags
Confidence rises with the sample — Low on a thin journal, High past a hundred trades. The profile always tells you how many trades it is standing on, and how many carry the tags that let it confirm what the numbers suggest.
Which trader you are right now
The profile names the pattern that dominates your trading in the selected range. Seven of the eight archetypes carry a flaw, and each names the one lever that would change the most — the exit, the hold, the timing, the size. The eighth, The Operator, is the one you're aiming for: plan followed, risk controlled, the hard part already done.
Every archetype is described from your own numbers, not a stock paragraph — how often you re-enter after a loss, how early you close winners, how much longer you hold losers than winners, what share of your trades fall outside your best hours.
| Archetype | The tell — and the lever |
|---|---|
| The Operator | Trades the plan, controls the risk. The read: this is your edge, not a flaw — the work now is sharpening edge, not fixing behaviour. |
| The Avenger | Trades the state, not the market. The lever: the trade after the loss — the fast, bigger re-entry is the leak to cap. |
| The Hesitant | Right often, paid little — cuts winners early. The lever: the exit, not your read. |
| The Holder | Won't call it a loss until it's closed. The lever: the hold, not the entry — honouring the stop. |
| The Gambler | Trades for the action, not the edge. The lever: selection, not activity — fewer, more selective trades. |
| The Overheater | Wins loosen the rules; size creeps up. The lever: holding size flat after wins. |
| The Chaser | Jumps in after the move's already gone. The lever: the timing, not the setup — waiting for the pullback. |
| The Off-Hours Trader | The method runs outside its best hours. The lever: the clock, not the method — shifting into your strong window. |
When your primary and secondary form a known pair, the profile names it and says in one line why the pair matters — Time bomb (revenge entries and held losses), Slow bleed (small wins, big losses), Untapped potential (a good base, one fix from working), Almost systematic (one vulnerability: win streaks), Right, but at the wrong time — twelve in all.
The radar, from Discipline to Fear ↔ Greed
Five spokes, each 0 to 100, each with its own detail › drill-down under the radar. The drill-down lists what went into the scale and marks anything that wasn't scored — so a low number is never a missing column in disguise.
Composure and Focus are a different kind of scale: they're folded from the deeper reads further down — your tilt patterns and your hourly edge map — and both feed straight into Edge.
- Discipline — how closely your trades match the plan you set before entry: stop honoured, winners managed, plan followed
- Composure — how well you stay on process after a loss; higher is calmer
- Stability — how consistent you are trade to trade: position size, hold time, trades per day, entry-time concentration
- Focus — how much of your edge sits in your best hours versus bleeding into dead time
- Fear ↔ Greed — how even your sizing stays after wins and losses: 100 is perfectly even; lower means you shrink after losses (fear) or push after wins (greed)
A component with no data is skipped, not counted as zero, and the drill-down says so — not scored. The Fear ↔ Greed drill-down also reads your sizing after wins and after losses on a plain scale from Fear ↓↓ to Greed ↑↑, and whether you run or cut your losers and your winners.
What limits your edge
One split bar answers the question that matters most: is the drag psychology or technique? The profile takes every losing trade and files what it cost you on one side or the other. A revenge or FOMO tag, a discretionary exit, a stop moved wider than planned — that's the head. A gap through the stop, slippage, a news spike, a stop set tighter than the market's own noise — that's the hands. A deliberate choice like scaling out is neither, and a loss with no signal at all is left unclassified rather than guessed.
The verdict is one sentence: "Technique is largely clean — the drag is behavioral", "You stay composed — but gaps, slippage and fills are costing you", or "It's split roughly evenly." Under it, a coverage line tells you what share of trades it could classify and where that came from — your tags on one side, your broker's exit data on the other. The rest it doesn't guess.
Tap either side of the bar and you get the tags behind it, each with how many trades carry it and the net R on those trades — green helps, red hurts. It's the fastest way to see which of your own labels actually costs money.
If a run of your stopped-out losses used a stop tighter than the market's volatility, the profile says so in blue — those are the market's noise, not a process error — and tells you what to try: widen the stop against volatility and the noise stop-outs thin out.
Your tilt profile
Tilt is when a result knocks you off process. The profile counts four specific patterns — counted, never inferred from a single event — and shows each one with a verdict: Detected, a handful of events, Clean, or Insufficient when there isn't enough data to judge. The row's summary reads like "4 detected · 0 occasional" before you even open it.
Each pattern comes with its evidence in a line — "Size crept up across a losing streak on 5 occasions", "Average R turns negative from 15:00 onward", "You wait after a big loss — clean".
- Fatigue tilt — your average result turns negative late in the session and stays there
- Serial tilt — size creeps up while you're inside a losing streak
- Loss-trigger tilt — a fast re-entry right after a big loss
- Missed-move tilt — chasing back in after cutting a winner short
Every detected pattern lowers your Composure spoke — and Composure feeds Edge. So a tilt habit isn't a footnote: it shows up in the headline number, and clearing it lifts the number back.
Seven cognitive traps
Patterns that quietly cost R. The profile checks for seven and names one only when the numbers — and your own tags — agree. The top three by severity are shown, each with a Critical, High or Moderate chip and a sentence of evidence from your journal.
- Disposition effect — holding losers longer than winners and giving profit back
- Gambler's fallacy — size climbs after two or three losses in a row, betting the streak "has to" turn
- Recency effect — each result colours the next; the last outcome predicts your following one
- Confirmation bias — a strong directional lean regardless of setup
- Illusion of control — trade count is high but win rate doesn't rise with it
- Overconfidence — recent win rate runs well above your baseline while discipline slips
- Loss aversion — the average loser dwarfs the average winner at a normal hit rate
Confidence cycle and emotional profile
The confidence cycle tells you where you are right now — Overheated, Streak-warm, Recovering or Steady — with a note for the very next entry: "You are 4 wins into a run. The next 1–2 entries are where size tends to creep — keep it flat." It's the closest thing to a coach reading over your shoulder before you click.
The emotional profile comes from your Emotion Before and Emotion After tags. A table per emotion — trades, win rate, average R, net R with a bar — and a generated line that names your best and worst states: "Calm is your edge — 41 calm entries returned +18.2R at 61% win. Anxious is the leak." It rewrites itself as the journal grows.
When one state keeps showing on your exits, the profile flags it as the one to watch on the very next entry. What you felt leaving the last trade is the risk on the next one.
Your hours, and what to do next
One bar per hour you trade, sized by your average result in that hour — bright green where you're strong, red where you're negative. The caption does the reading for you: "Your strongest hour is 09:00 (avg +0.42R). After 15:00 average R turns negative — a hard time-stop protects the day." This is the map the Focus scale and the Off-Hours read are built on.
Then Do this next: up to four numbered moves, generated from your own numbers, each concrete enough to act on tomorrow.
- "Cap risk per trade at a fixed ceiling. Your edge does not need the big bets — it needs to survive the streaks."
- "After 3 wins in a row, hold size flat for two trades. That is where the data shows size starts to run."
- "Set a session time-stop where your average R turns negative — protect the day rather than give it back."
- "Standardize your position size — it varies more than any other part of your process and drags Stability down."
- "Honor your stop." — with the share of your trades that let risk run past the plan
How you're changing, block by block
Press Compare in the hub header and the profile stops being a snapshot and becomes a trajectory. Your current range is cut into ordered blocks along one axis — calendar months, calendar weeks, every N trading days, or every N trades — and the latest two to eight blocks line up oldest to newest. The full profile is computed for each block on its own, so you're comparing like with like.
The question changes from "who am I?" to "who was I in March, and who am I now?" — and, more usefully, "what moved?"
- Edge, then and now — the first block's dial next to the latest, the delta, and a word: improving, slipping or flat
- The five scales as from → to — Discipline 52 → 68, with Fear ↔ Greed marked steady, cooled or heated
- Who you were, block by block — your primary archetype in every block, with the best and the lowest block marked
- The gradation — a heatmap of Trades, Edge and all five scales per block; greener cell, healthier block
- The story — one line naming your low and the single scale that moved most: "The lift is discipline — you traded closer to plan", "The drag is focus — edge bled into weaker hours"
| Axis | Each block is |
|---|---|
| Months | one calendar month |
| Weeks | one calendar week, Monday to Sunday |
| Trading days | every N days you actually traded — you pick N |
| Trades | every N trades — 50 by default, you pick N |
On the trading-days and trades axes, blocks are cut to the same size, so a busy stretch isn't judged against a quiet one on volume alone. Trades without a timestamp are skipped and counted, never silently dropped — and if there aren't at least two blocks yet, the screen says so and shows a preview instead of a verdict.
Two keys before a label
Trading-psychology tools have a bad habit: they read a number and call it a feeling. The Psyche Profile refuses to. A psychological pattern is never asserted on a number alone — it needs the signal and a corroborating intent tag from you. A number with a mechanical explanation available is called technique, not psychology.
A fast loss can be a tight stop, not panic. A held loss can be a gap through your stop. A low win rate can be a style. Each is checked before anything is said. Until your tags confirm it, a read stays what the app calls "a pattern to watch, not a verdict" — and it tells you exactly which tags would confirm or clear it.
And where it can't tell, it abstains. Missing column or small sample means not scored, never a fabricated zero. Confidence rises as you tag more.
- Not AI — built only from our own calculations on your statistics; no model guessing at you
- No market data, no broker terminal, nothing to connect — the journal is enough
- Nothing free-text is read — no notes, comments or screenshots; only your results, numbers and the tags you choose
- Every read ends with the same line: guidance, not instructions. The decision, and the responsibility, are yours
In Mentoring and Team oversight the same profile — Compare included — is available read-only for every connected trader, computed from the trade sheet they've shared. A mentor can finally see why a mentee's month went wrong, not just that it did.
A read of your trades, not a diagnosis
The archetypes, scales and reads on this tab are names for patterns in your trade statistics — nothing more. The Avenger means your journal shows fast, bigger re-entries after losses; it does not mean you are angry, and it is not a statement about your personality, your state of mind or your mental health.
None of it is a psychological, clinical or professional assessment, and none of it is advice. It is produced only by our own calculations on the numbers and tags you logged, and it may not describe you accurately — a tight stop can look like panic, a busy week can look like a habit. That is why the app abstains when the data is thin and hedges when your tags don't confirm a read.
Treat it as information. Take it in, ignore it, or try an adjustment and watch what the next block of trades says. You manage your own trading — the decision, and the responsibility, are yours.
"These reads are built only from our own calculations on your statistics — guidance, not instructions. You manage your own trading: take them in, ignore them, or try adjusting and watch the result. The decision, and the responsibility, are yours."
Built from the journal you already keep
There's no questionnaire and no new screen to fill in. The profile reads what's already in your trade sheet: the result you marked, net R with fees included, your risk, entry and exit timestamps, ticker and direction. That alone gives you Edge, Stability, the energy map and the structural archetypes.
Every optional column you add unlocks more, and the profile tells you which ones are missing — with an Add all columns button that adds them to the sheet in one click.
- 20 trades in the selected range for the profile itself — below that the whole screen is a greyed preview that fills in as you log
- 30 trades for archetypes and the emotional profile, 50 for cognitive traps, 60 for the confidence cycle
- Follows the same Range as the rest of the hub — Today, This Week, This Month, This Quarter, This Year, All, Custom or Last N trades — and the sheet's own filters
| Column | Unlocks |
|---|---|
| Trade Context | One tag column that separates technique from psychology — 18 built-in tags, from Gapped through stop and Slippage to Revenge entry and FOMO / chased; add your own |
| Exit Reason · Stop Loss Price · Take Profit Price · Max R | The Discipline components — stop honoured, winners managed — and the head-vs-hands split |
| Emotion Before · Emotion After · Mistakes · Followed Plan | The emotional profile, and the second key that confirms a psychological read |
| Market Condition · Stop ATR Multiple · Session | The tight-stop check, news and volatility filed under technique, and the Off-Hours read |
Frequently asked
Is the Psyche Profile AI?
No. It's built only from our own calculations on your statistics — the numbers in your journal and the tags you log. There is no model guessing at you, no market data and nothing to connect.
How many trades does it need?
At least 20 trades in the selected range for the profile itself. Archetypes and the emotional profile need 30, cognitive traps 50, the confidence cycle 60. Below 20 you see a greyed preview that fills in as you log.
Can it label me wrong?
It's built not to. A psychological read needs two keys — the numbers and a corroborating tag from you — and anything with a mechanical explanation is filed under technique. Where it can't tell, it says "not scored" rather than guess, and a read the tags haven't confirmed is shown as a pattern to watch, not a verdict.
Is this a psychological assessment?
No. The archetypes, scales and reads are names for patterns in your trade data, produced only by our own calculations on your statistics. They are not a psychological, clinical or professional evaluation of you, and they may not describe your actual state of mind. Treat them as information — take them in, ignore them, or try an adjustment and watch the result. The decision, and the responsibility, are yours.
What does Compare show?
Your trajectory. The current range is cut into ordered blocks — by month, by week, every N trading days or every N trades — and for each block you get Edge, the five scales and your archetype, plus a heatmap and a one-line story of what moved most.
Does it read my notes or screenshots?
No. It reads structured fields only — results, R, sizes, timestamps and the dropdown tags you choose. Free text is never read.
Is it on the Free plan?
Yes. The Psyche Profile is part of the Analytics Hub, which is included on every plan. Mentors and team leads also see it, read-only, for each connected trader.
Find out who's really trading your account
Free to start, local-first, on macOS and Windows. No card required.